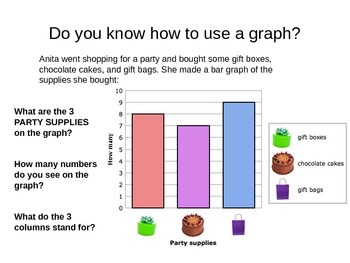
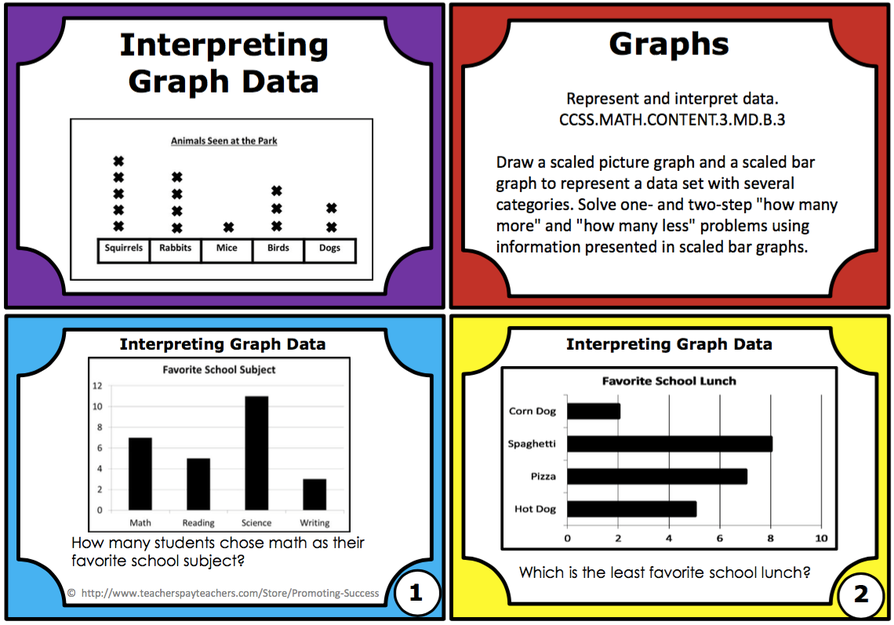
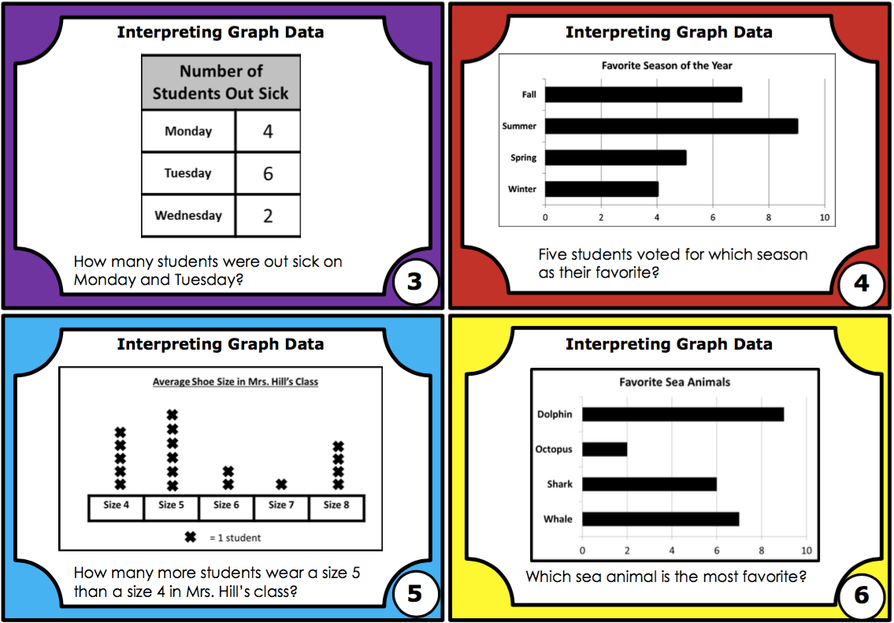
CCSS.MATH.CONTENT.3.MD.B.3 Draw a scaled picture graph and a scaled bar graph to represent a data set with several categories. Solve one- and two-step "how many more" and "how many less" problems using information presented in scaled bar graphs. For example, draw a bar graph in which each square in the bar graph might represent 5 pets.

Represent and Interpret Data
Standards:
CCSS.MATH.CONTENT.3.MD.B.4 Generate measurement data by measuring lengths using rulers marked with halves and fourths of an inch. Show the data by making a line plot, where the horizontal scale is marked off in appropriate units— whole numbers, halves, or quarters.
Content:
Prior Knowledge:
Students can generate measurement data by measuring lengths of several objects to the nearest whole unit, or by making repeated measurements of the same object. Show the measurements by making a line plot, where the horizontal scale is marked off in whole-number units.
Students can draw a picture graph and a bar graph (with single-unit scale) to represent a data set with up to four categories. Solve simple put-together, take-apart, and compare problems1 using information presented in a bar graph.
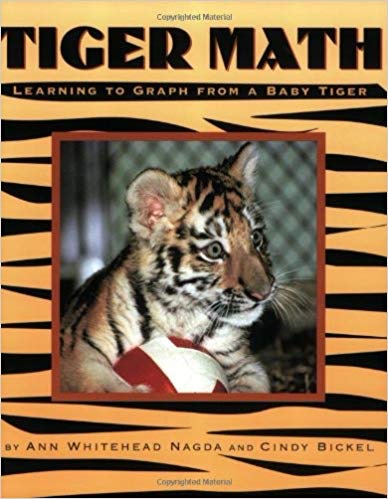
Children learn to graph as they follow the growth of an orphaned Siberian tiger cub. This book introduces a basic math skill through a fun narrative about an animal.
Application of Content & Lesson Planning
https://share.nearpod.com/vsph/qCu8S2fXPz
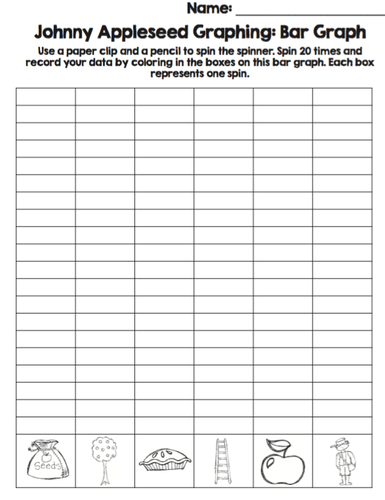
This activity involves students using a spinner to collect data on what they land on, which they will then graph and analyze.
Assessment
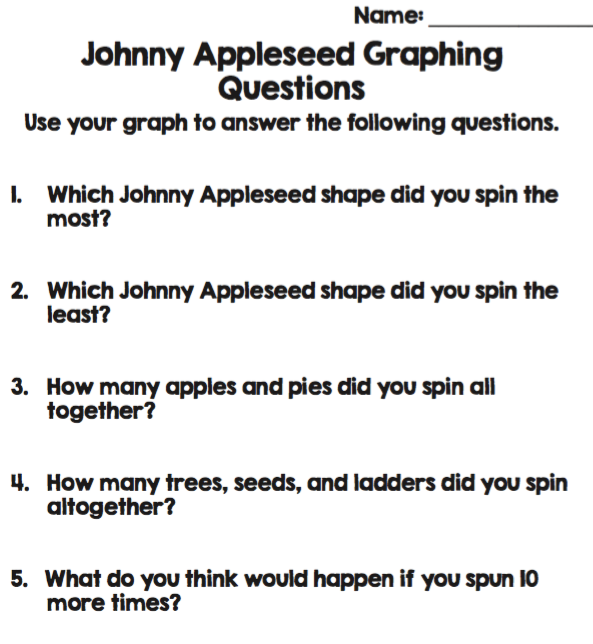
This assessment coordinates with the Johnny Appleseed Graphing: Bar Graph activity above. It asses how well students can collect information from a graph, specifically one they have created.
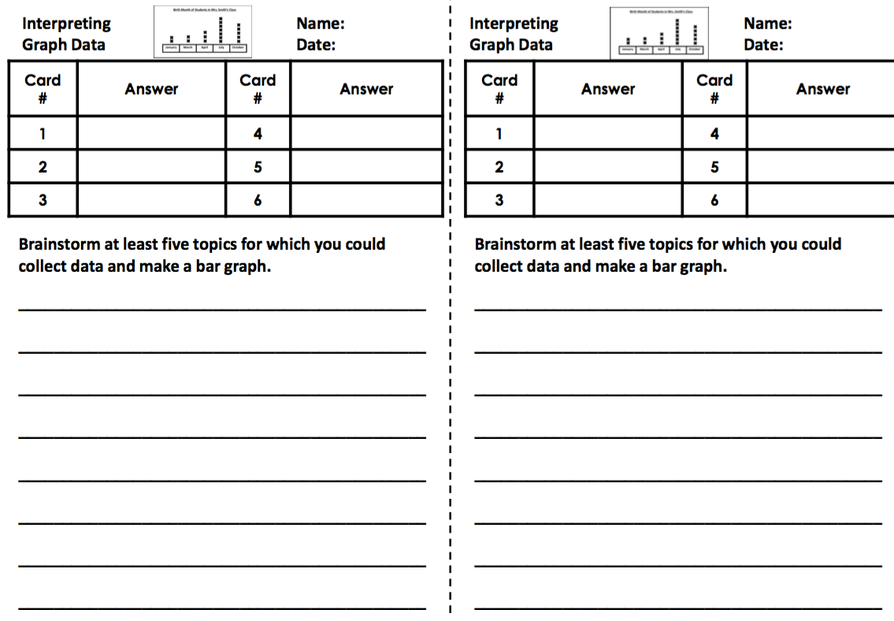
This assessment is based off of the task cards above which contain several different types of gaphs, each representing difference sets of data.